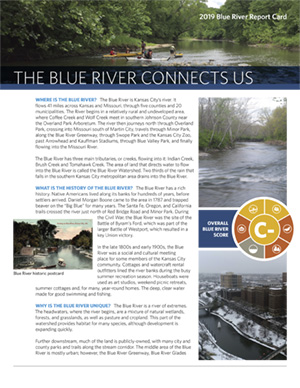
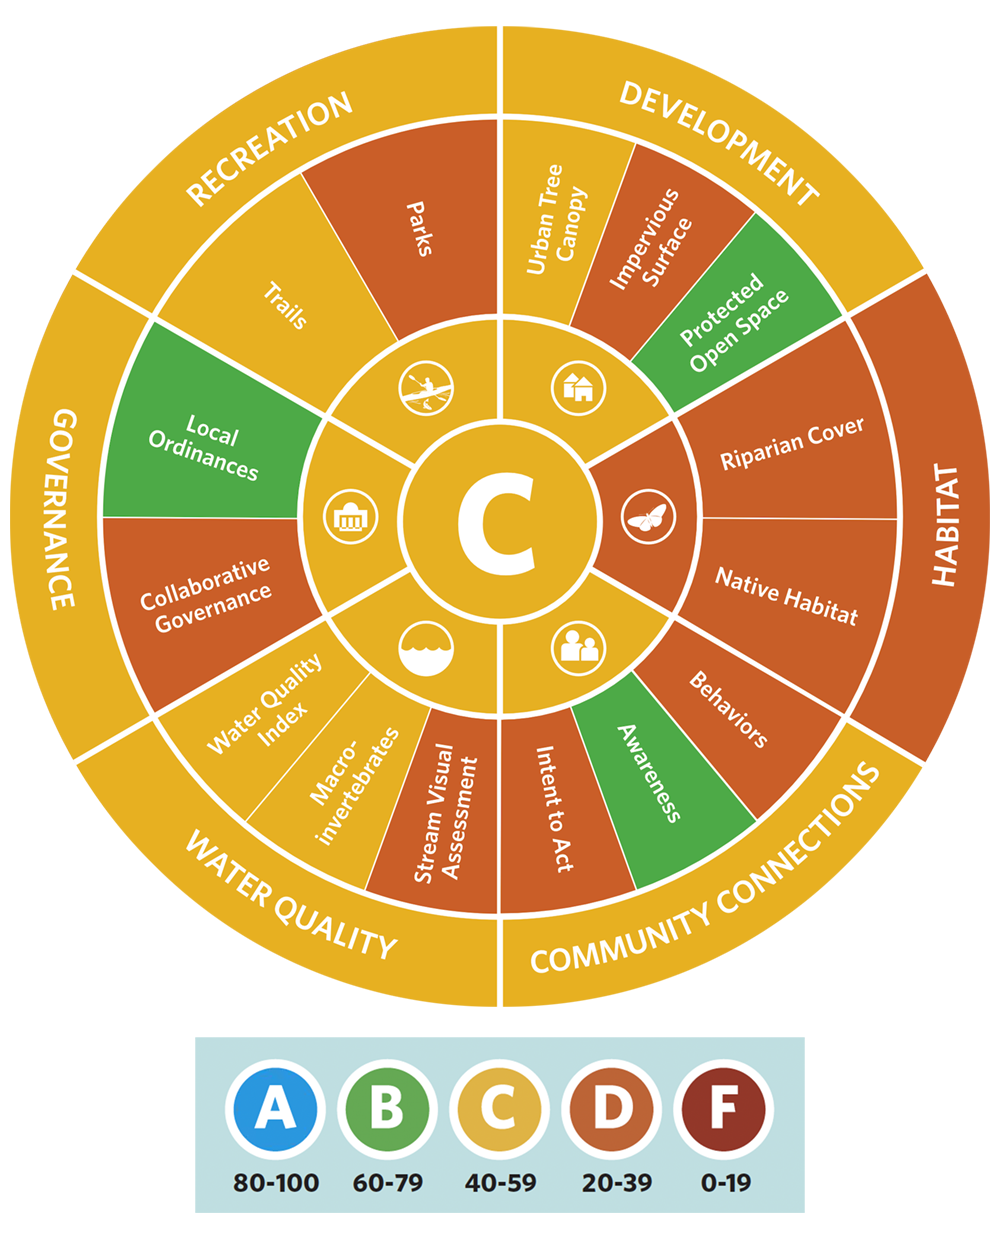
By combining data from a diverse set of categories and indicators, the Report Card offers a comprehensive understanding of environmental conditions, local and regional policies, and community connections throughout the watershed and measures change over time. The six evaluation categories measured include:
Blue River Report Card
This science-based, data-driven assessment provides a holistic view of the Blue River Watershed's health and the community’s relationship to it. As an iterative tool, it tracks key indicators over time, helping measure progress and guide actions that improve the watershed’s overall health—and its report card grade.
Blue River Report Card
Blue River Report Card
This science-based, data-driven assessment provides a holistic view of the Blue River Watershed's health and the community’s relationship to it. As an iterative tool, it tracks key indicators over time, helping measure progress and guide actions that improve the watershed’s overall health—and its report card grade.
Blue River Report Card Community ConnectionsHow do communities relate to the Blue River? |
 DevelopmentHow do development practices impact the Blue River? |
 GovernanceHow are local government actions and policies affecting the Blue River? |
 HabitatHow much natural habitat exists along the Blue River to maintain a healthy ecosystem? |
 RecreationHow does the community interact with and seek enjoyment from the Blue River? |
 Water QualityHow clean is the water in the Blue River to provide for aquatic life and community recreation? |

Community Connections
How do communities relate to the Blue River?

Development
How do development practices impact the Blue River?

Governance
How are local government actions and policies affecting the Blue River?

Habitat
How much natural habitat exists along the Blue River to maintain a healthy ecosystem?

Recreation
How does the community interact with and seek enjoyment from the Blue River?

Water Quality
How clean is the water in the Blue River to provide for aquatic life and community recreation?
How Healthy is the Blue River?
In 2025, the Blue River Watershed earned an overall “C” grade, scoring 47% on the Blue River Report Card. To reflect regional differences, the watershed is divided into three independently scored subwatersheds—Upper (“C”), Middle (“C”), and Lower (“D+”)—with health generally declining farther downstream.
While the overall grade changed little from 2021 (46%, also a “C”), several indicators showed meaningful progress. More stream miles are now fully vegetated along their banks (Riparian Cover indicator), additional open space has been permanently protected from development (Protected Open Space indicator), and water quality improved in several tributaries (Macroinvertebrates indicator).
At the same time, important challenges remain. Many cities and counties have not fully adopted watershed protection measures (Local Ordinance indicator), the amount of protected parkland has declined (Parks indicator), and stream habitat conditions continue to deteriorate (Stream Visual Assessment indicator). Overall, 58% of the report card indicators received a grade of D or lower, highlighting the need for continued investment and collaboration to improve watershed health.
The 2025 Report Card demonstrates that while progress is being made, sustained action is needed to create a healthier, more resilient Blue River Watershed. Read the full report card to explore the data and learn how you can help.
Explore Past Report Cards & Action Plans
Click the plus icon to view resources.
Turning Data Into Action
The Blue River Report Card empowers Kansas City communities and local jurisdictions to take action for a healthier watershed. By making environmental data accessible and actionable, it supports informed decision-making, the development and improvement of local policies, targeted conservation efforts, and long-term improvements across the Blue River.
What is your jurisdiction doing to protect the watershed?
Communities and stakeholders can use this information to advance watershed protection by encouraging jurisdictions to adopt the manuals and ordinances listed in the table. These tools establish clear, consistent, environmentally protective standards for development, stormwater management, and land use. By advocating for their adoption and supporting implementation, stakeholders help translate watershed goals into enforceable policies that improve water quality, reduce flooding, and strengthen long-term ecological health.
How Did Your Jurisdiction Score?
Contact your city or county today to advocate for these policy adoptions and share your priorities for the watershed.
If you have questions or would like more information about the Blue River Report Card, please email resources@heartlandconservationalliance.org
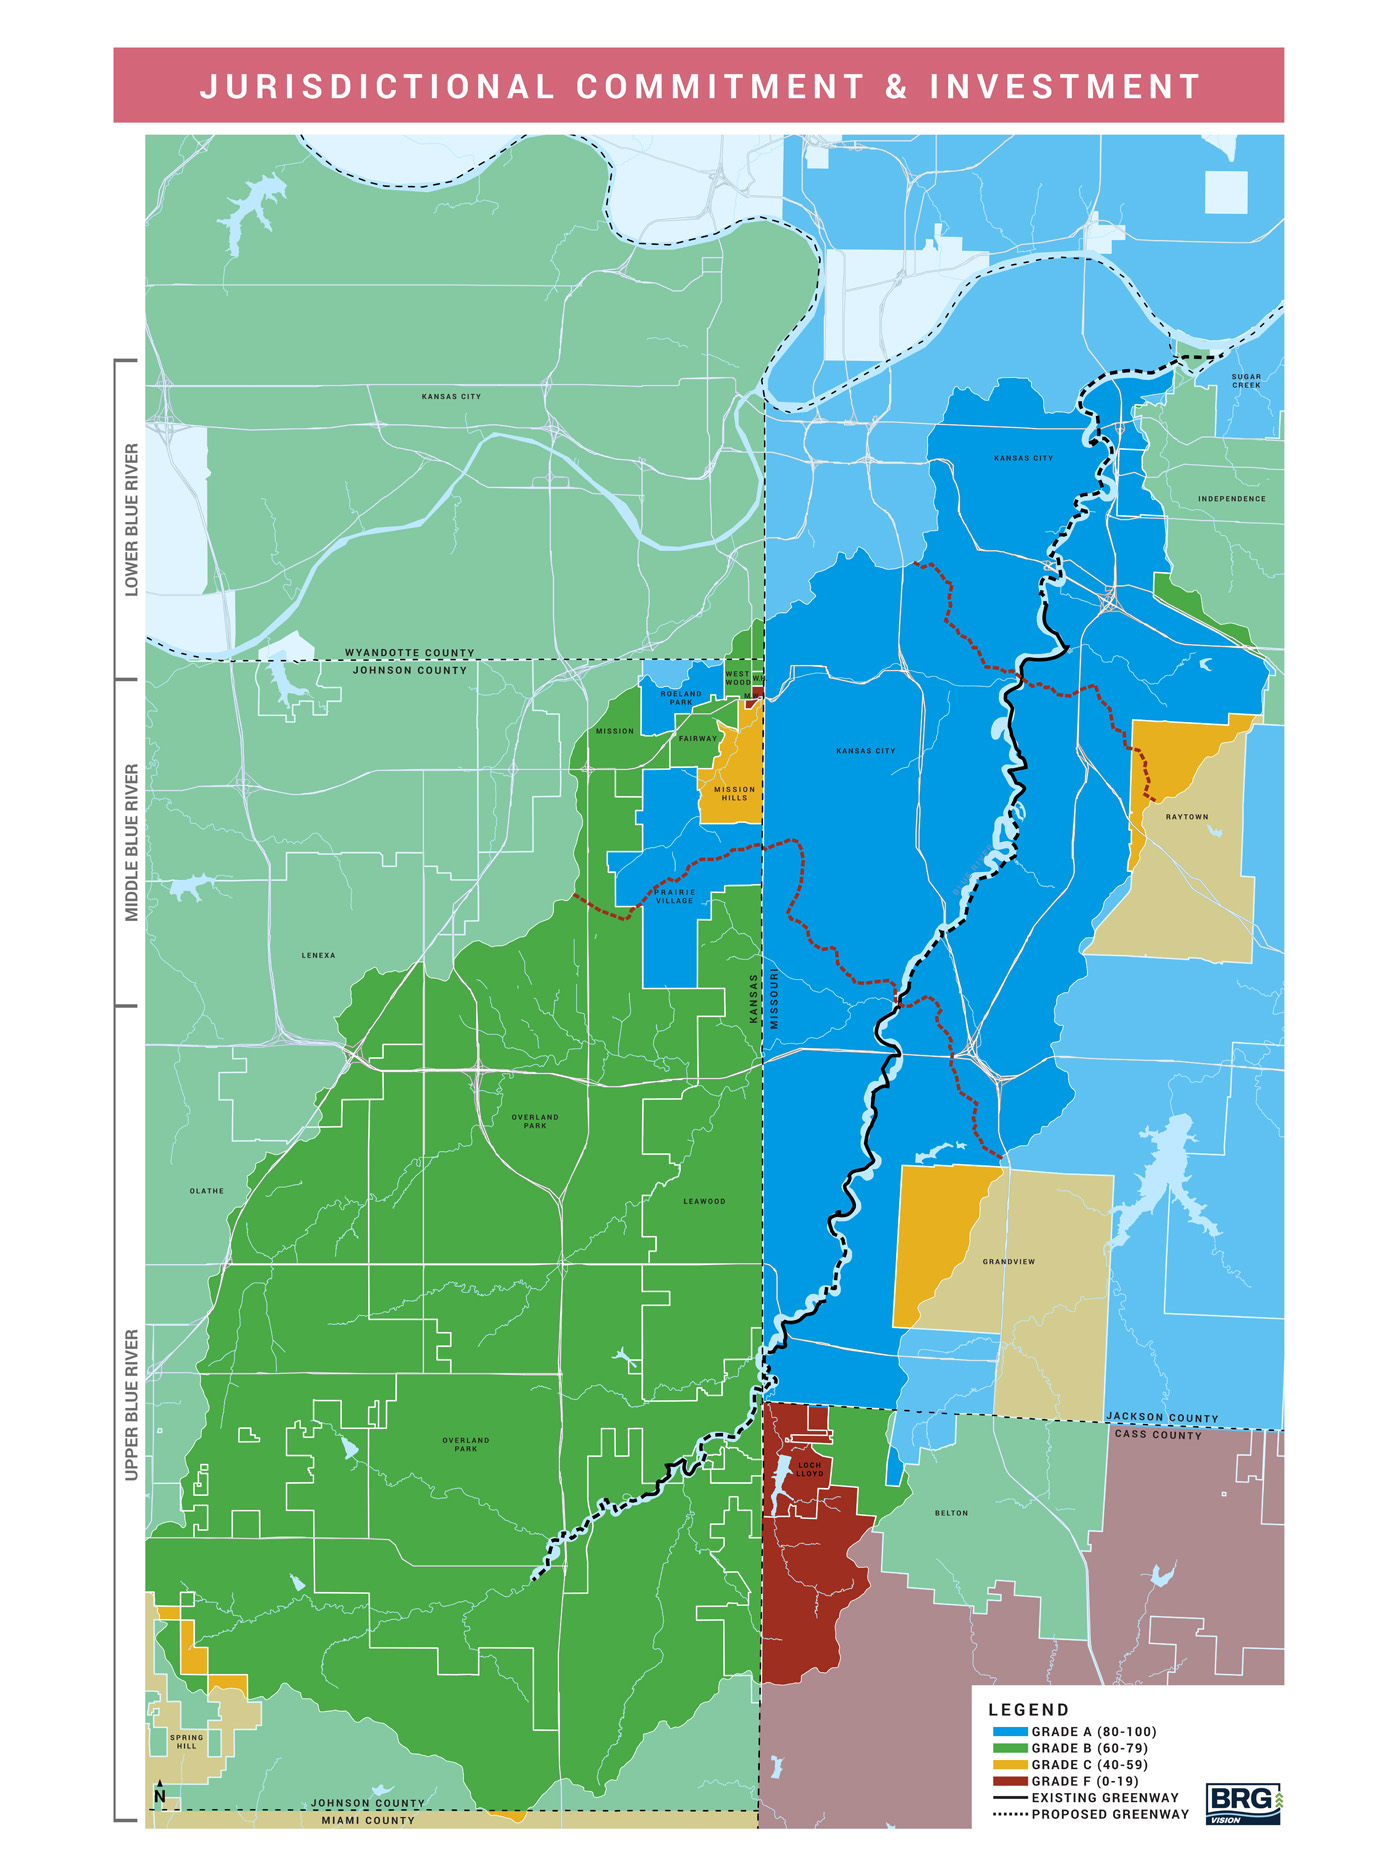
The map above shows each Blue River Watershed jurisdiction’s 2025 report card grade for Governance Indicator 1, which evaluates the number of environmentally friendly local ordinances protecting the Blue River. Click here to view the ordinance data by jurisdiction, which is updated as new ordinances are adopted.